Suicide Mortality in the United States, 1999–2017
NCHS Data Brief No. 330, November 2018
Holly Hedegaard, M.D., Sally C. Curtin, M.A., and Margaret Warner, Ph.D.
Key findings
Data from the National Vital Statistics System, Mortality
- From 1999 through 2017, the age-adjusted suicide rate increased 33% from 10.5 to 14.0 per 100,000.
- Suicide rates were significantly higher in 2017 compared with 1999 among females aged 10–14 (1.7 and 0.5, respectively), 15–24 (5.8 and 3.0), 25–44 (7.8 and 5.5), 45–64 (9.7 and 6.0), and 65–74 (6.2 and 4.1).
- Suicide rates were significantly higher in 2017 compared with 1999 among males aged 10–14 (3.3 and 1.9, respectively), 15–24 (22.7 and 16.8), 25–44 (27.5 and 21.6), 45–64 (30.1 and 20.8) and 65–74 (26.2 and 24.7).
- In 2017, the age-adjusted suicide rate for the most rural (noncore) counties was 1.8 times the rate for the most urban (large central metro) counties (20.0 and 11.1 per 100,000, respectively).
Since 2008, suicide has ranked as the 10th leading cause of death for all ages in the United States (1). In 2016, suicide became the second leading cause of death for ages 10–34 and the fourth leading cause for ages 35–54 (1). Although the Healthy People 2020 target is to reduce suicide rates to 10.2 per 100,000 by 2020 (2), suicide rates have steadily increased in recent years (3,4). This data brief uses final mortality data from the National Vital Statistics System (NVSS) to update trends in suicide mortality from 1999 through 2017 and to describe differences by sex, age group, and urbanization level of the decedent’s county of residence.
Keywords: death certificates, intentional self-harm, urban-rural, National Vital Statistics System
From 1999 through 2017, suicide rates increased for both males and females, with greater annual percentage increases occurring after 2006.
- From 1999 through 2017, the age-adjusted suicide rate increased 33% from 10.5 per 100,000 standard population to 14.0 (Figure 1). The rate increased on average by about 1% per year from 1999 through 2006 and by 2% per year from 2006 through 2017.
- For males, the rate increased 26% from 17.8 in 1999 to 22.4 in 2017. The rate did not significantly change from 1999 to 2006, then increased on average by about 2% per year from 2006 through 2017.
- For females, the rate increased 53% from 4.0 in 1999 to 6.1 in 2017. The rate increased on average by 2% per year from 1999 through 2007 and by 3% per year from 2007 through 2017.
Figure 1. Age-adjusted suicide rates, by sex: United States, 1999–2017
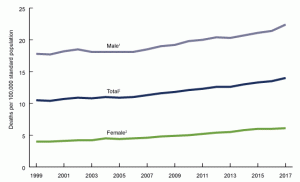
1Stable trend from 1999 through 2006; significant increasing trend from 2006 through 2017, p < 0.001.
2Significant increasing trend from 1999 through 2017 with different rates of change over time, p < 0.001.
NOTES: Suicides are identified using International Classification of Diseases, Tenth Revision underlying cause-of-death codes U03, X60–X84, and Y87.0. Age-adjusted death rates were calculated using the direct method and the 2000 U.S. standard population. Access data table for Figure 1 .
SOURCE: NCHS, National Vital Statistics System, Mortality.
Suicide rates for females aged 10–74 were higher in 2017 than in 1999.
- Suicide rates for females were highest for those aged 45–64 in both 1999 (6.0 per 100,000) and 2017 (9.7) (Figure 2).
- Suicide rates were significantly higher in 2017 compared with 1999 among females aged 10–14 (1.7 and 0.5, respectively), 15–24 (5.8 and 3.0), 25–44 (7.8 and 5.5), 45–64 (9.7 and 6.0), and 65–74 (6.2 and 4.1).
- The suicide rate in 2017 for females aged 75 and over (4.0) was significantly lower than the rate in 1999 (4.5).
Figure 2. Suicide rates for females, by age group: United States, 1999 and 2017
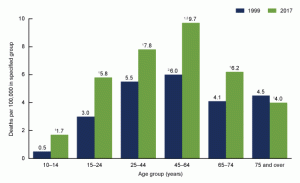
1Significantly different from 1999 rate, p < 0.05.
2Significantly higher than rates for all other age groups in 1999, p < 0.05.
3Significantly higher than rates for all other age groups in 2017, p < 0.05.
NOTES: Suicides are identified using International Classification of Diseases, Tenth Revision underlying cause-of-death codes U03, X60–X84, and Y87.0. Access data table for Figure 2.
SOURCE: NCHS, National Vital Statistics System, Mortality.
Suicide rates for males aged 10–74 were higher in 2017 than in 1999.
- Suicide rates for males were highest for those aged 75 and over in both 1999 (42.4 per 100,000) and 2017 (39.7) (Figure 3)
- Suicide rates were significantly higher in 2017 compared with 1999 among males aged 10–14 (3.3 and 1.9, respectively), 15–24 (22.7 and 16.8), 25–44 (27.5 and 21.6), 45–64 (30.1 and 20.8), and 65–74 (26.2 and 24.7).
- The suicide rate in 2017 for males aged 75 and over (39.7) was significantly lower than the rate in 1999 (42.4).
Figure 3. Suicide rates for males, by age group: United States, 1999 and 2017
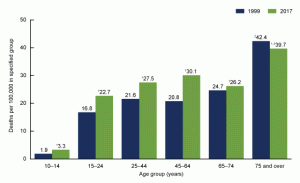
1Significantly different from 1999 rate, p < 0.05.
2Significantly higher than rates for all other age groups in 1999, p < 0.05.
3Significantly higher than rates for all other age groups in 2017, p < 0.05.
NOTES: Suicides are identified using International Classification of Diseases, Tenth Revision underlying cause-of-death codes U03, X60–X84, and Y87.0. Access data table for Figure 3.
SOURCE: NCHS, National Vital Statistics System, Mortality.
The difference in age-adjusted suicide rates between the most rural and most urban counties was greater in 2017 than in 1999.
- In both 1999 and 2017, the age-adjusted suicide rate increased with decreasing urbanization (Figure 4). In 1999, the age-adjusted suicide rate for the most rural (noncore) counties (13.1 per 100,000) was 1.4 times the rate for the most urban (large central metro) counties (9.6). This difference increased in 2017, with the suicide rate for the most rural counties (20.0 per 100,000) increasing to 1.8 times the rate for the most urban counties (11.1).
- The age-adjusted suicide rate for the most urban counties in 2017 (11.1 per 100,000) was 16% higher than the rate in 1999 (9.6).
- The age-adjusted suicide rate for the most rural counties in 2017 (20.0 per 100,000) was 53% higher than the rate in 1999 (13.1).
Figure 4. Age-adjusted suicide rates, by county urbanization level: United States, 1999 and 2017
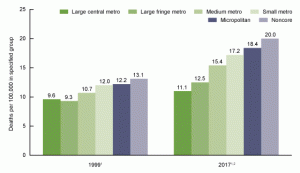
1Significantly increasing suicide rates by decreasing urbanization, p < 0.05.
2Significantly higher than 1999 rate for each level of urbanization, p < 0.05.
NOTE: Suicides are identified using International Classification of Diseases, Tenth Revision underlying cause-of death codes U03, X60–X84, and Y87.0. Age-adjusted death rates are calculated using the direct method and the 2000 U.S. standard population. Classification of the decedent’s county of residence is based on the 2006 NCHS Urban–Rural Classification Scheme for Counties, available from: https://www.cdc.gov/nchs/data/series/sr_02/sr02_154.pdf. Categories are presented from most urban (large central metro) to least urban (small metro), and from rural (micropolitan) to most rural (noncore). Access data table for Figure 4.
SOURCE: NCHS, National Vital Statistics System, Mortality.
Summary
This report highlights trends in suicide rates from 1999 through 2017. During this period, the age-adjusted suicide rate increased 33% from 10.5 per 100,000 in 1999 to 14.0 in 2017. The average annual percentage increase in rates accelerated from approximately 1% per year from 1999 through 2006 to 2% per year from 2006 through 2017. The age-adjusted rate of suicide among females increased from 4.0 per 100,000 in 1999 to 6.1 in 2017, while the rate for males increased from 17.8 to 22.4. Compared with rates in 1999, suicide rates in 2017 were higher for males and females in all age groups from 10 to 74 years. The differences in age-adjusted suicide rates between the most rural (noncore) and most urban (large central metro) counties was greater in 2017 than in 1999. In 1999, the age-adjusted suicide rate for the most rural counties (13.1 per 100,000) was 1.4 times the rate for the most urban counties (9.6), while in 2017, the age-adjusted suicide rate for the most rural counties (20.0) was 1.8 times the rate for the most urban counties (11.1). The age-adjusted suicide rate for the most urban counties in 2017 (11.1 per 100,000) was 16% higher than the rate in 1999 (9.6), while the rate for the most rural counties in 2017 (20.0) was 53% higher than the rate in 1999 (13.1).
Data sources and methods
Data were analyzed using the NVSS multiple cause-of-death mortality files for 1999 through 2017 (5). Suicide deaths were identified using International Classification of Diseases, Tenth Revision (ICD–10) underlying cause-of-death codes U03, X60–X84, and Y87.0 (6). Age-adjusted death rates were calculated using the direct method and the 2000 U.S. standard population (7). Suicides for persons aged 5–9 years were included in the total numbers and age-adjusted rates but not shown as part of the age-specific numbers or rates, due to the small number of suicide deaths among this age group.
Urbanization level of the decedent’s county of residence was categorized using the 2006 NCHS Urban–Rural Classification Scheme for Counties (8). Counties were classified into six urbanization levels based on metropolitan–nonmetropolitan status, population distribution, and other factors. The six urbanization levels ranged from the most urban (large central metro) to the most rural (noncore). Metropolitan counties include large central counties, the fringes of large counties (suburbs), medium counties, and small counties. Nonmetropolitan counties (i.e., rural counties) include micropolitan statistical areas and noncore areas, including open countryside, rural towns (populations of less than 2,500), and areas with populations of 2,500–49,999 that are not part of larger labor market areas (metropolitan areas).
Trends in age-adjusted death rates were evaluated using the Joinpoint Regression Program (9). The Joinpoint software was used to fit weighted least-squares regression models to the estimated proportions on the linear scale. The default settings allowed for as few as four observed time points in the beginning, ending, and middle line segments, including the joinpoints. Using these settings, a maximum of three joinpoints were searched for using the grid search algorithm and permutation test, and an overall alpha level of 0.05 (10). Pairwise comparisons of rates in Figures 2–4 were conducted using the z test statistic with an alpha level of 0.05 (7).
About the authors
Holly Hedegaard is with the National Center for Health Statistics, Office of Analysis and Epidemiology, and Sally C. Curtin and Margaret Warner are with the National Center for Health Statistics, Division of Vital Statistics.
References
-
- Centers for Disease Control and Prevention. CDC WISQARS: Leading causes of death reports, 1981–2016 .
- U.S. Department of Health and Human Services. Healthy People 2020: Mental health status improvement 2010 .
- Hedegaard H, Curtin SC, Warner M. Suicide rates in the United States continue to increase. NCHS Data Brief, no 309. Hyattsville, MD: National Center for Health Statistics. 2018
- Curtin SC, Warner M, Hedegaard H. Increase in suicide in the United States, 1999–2014. NCHS Data Brief, no 241. Hyattsville, MD: National Center for Health Statistics. 2016
- National Center for Health Statistics. Public-use data files: Mortality multiple cause files. 2017.
- World Health Organization. International statistical classification of diseases and related health problems, tenth revision (ICD–10). 2008 ed. Geneva, Switzerland. 2009.
- Xu JQ, Murphy SL, Kochanek KD, Bastian B, Arias E. Deaths: Final data for 2016. National Vital Statistics Reports; vol 67 no 5. Hyattsville, MD: National Center for Health Statistics. 2018.
- Ingram DD, Franco SJ. NCHS urban–rural classification scheme for counties. National Center for Health Statistics. Vital Health Stat 2(154). 2012.
- National Cancer Institute. Joinpoint Regression Program (Version 4.4.0.0) [computer software]. 2016.
- Ingram DD, Malec DJ, Makuc DM, Kruszon-Moran D, Gindi RM, Albert M, et al. National Center for Health Statistics Guidelines for Analysis of Trends. National Center for Health Statistics. Vital Health Stat 2(179). 2018.
Suggested citation
Hedegaard H, Curtin SC, Warner M. Suicide mortality in the United States, 1999–2017. NCHS Data Brief, no 330. Hyattsville, MD: National Center for Health Statistics. 2018.
Copyright information
All material appearing in this report is in the public domain and may be reproduced or copied without permission; citation as to source, however, is appreciated.
National Center for Health Statistics
Charles J. Rothwell, M.S., M.B.A., Director
Jennifer H. Madans, Ph.D., Associate Director for Science
Office of Analysis and Epidemiology
Irma E. Arispe, Ph.D., Director
Irma E. Arispe, Ph.D., Acting Associate Director for Science
Division of Vital Statistics
Steven Schwartz, Ph.D., Director
Hanyu Ni, Ph.D., M.P.H., Associate Director for Science